- Installing JMRI
- Getting Started
- Using DecoderPro®
- DecoderPro® Programming Modes
- The Basic Programmer
- The Comprehensive Programmer
- The Advanced Programmer
-
- Starting Advanced Programmer
- Function Labels Pane
- Roster Media
- Expanded Basic Pane
- Motor Control Pane
- Speed Control Pane
- Speed Table Pane
- Function Mapping Pane
- Lights Pane
- Consisting Pane
- Advanced Features Pane
- Analog Controls Pane
- Sound Pane
- Sound Levels Pane
- Global CV Pane
- Manufacturer-Specific Pane
- Printing the Decoder Data
- DecoderPro® Main Window
- JMRI® Operations Program
- Creating a Decoder Definition
- Error Messages
DecoderPro® Comprehensive Programmer
The Speed Table Pane
The Speed Table allows you to fine-tune the throttle response of your locomotive. You might opt to match all of your locomotives so they run at the same speed for the same throttle setting, or you might want to set the table up so that your locomotive runs at the actual scale speed indicated by the throttle. Or maybe you have someone in your operating group that likes to switch the yard at Mach 2.5, and you want to slow them down a bit. There are a lot of ways to use this feature. (This feature may vary by manufacturer and decoder series)
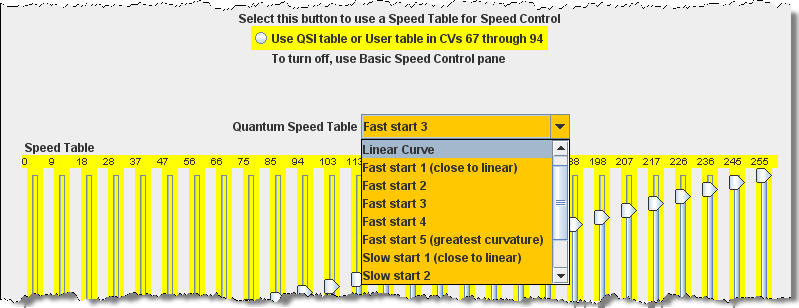
You now have the option of using Speed Table (this pane) which if selected and written to the decoder will replace the Basic Speed Control to set your locomotive's speed control mode. Which ever one you select last and write to your decoder will be the method used for speed control. To select the use of speed tables, the Use Table radio button is selected at the top of the pane, and in the case of Soundtraxx and QSI decoders, the drop down selection box must be used. See the discussion at the end of this section for an example.
Not all decoders allow speed table programming and some are limited to fixed curves, usually selected by a drop-down list.
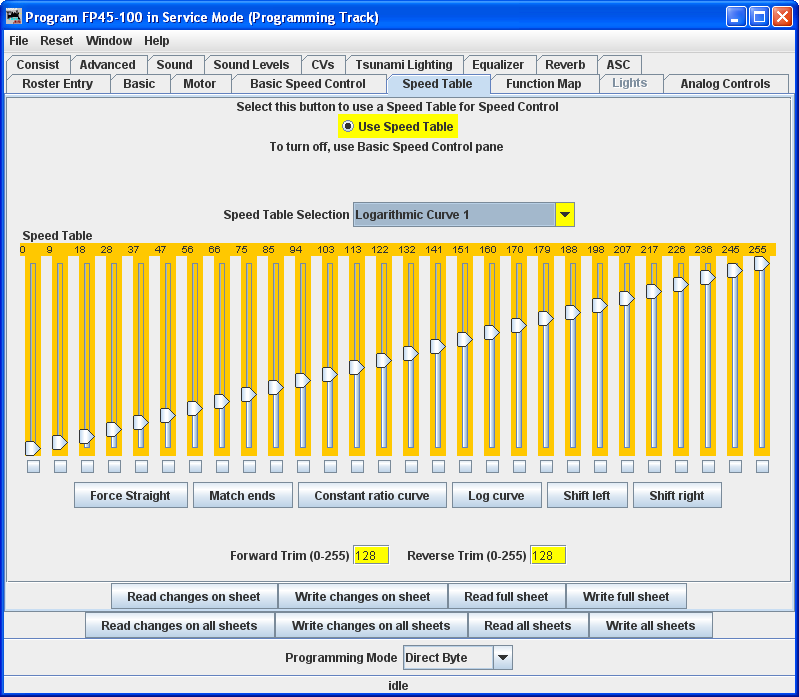
The default speed table for most decoders is a straight line from zero on the left to maximum on the right. The below the table duplicates that in the table..
Straight Line Speed Curve
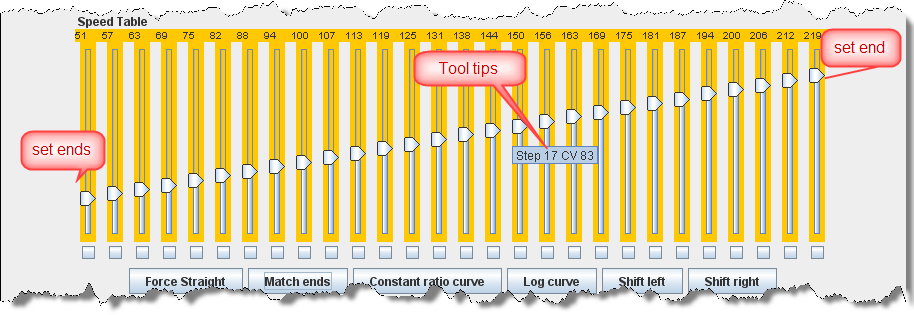
As you can see, you have both numbers and sliders to work with. Changing either a number or slider will make the other change to match it. If you are CV inquisitive, you can use the tool tip to advantage. By hovering over any of the sliders, the tool tip will reveal the CV to which you are pointing .
The will also result in a straight-line graph, but you can offset the beginning and end by any amount you wish. The first and last steps are used to set to minimum and maximum values for the straight line. The function will then draw a straight line between those two end points. Below is an example of the result.
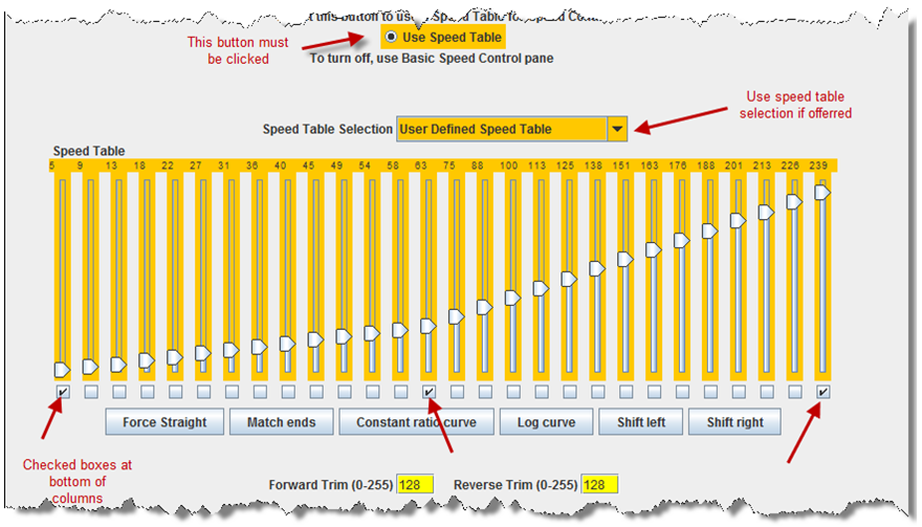
Now if you've used DecoderPro in the past, you're probably wondering what those little boxes at the bottom of each slider are used for. Well, they're difficult to explain, but easy to use. They basically allow you to set a slider to control every slider in columns to its left as well as to its right. If you click two of the boxes and then move one of those sliders you'll see that they are linked to the sliders between them. Points to the right never are higher than the slider being moved, and the points to the left are never lower that the slider being moved. This “always increasing left to right” is normally the way the sliders worked, but now the ones in between the check are linked. If the slider is lowered and then raised the straight line is drawn between the column checked to the right and the column that the slider is controlling. It's difficult to describe, but try it and you'll see.
What could that possibly be used for, you ask? Well, many decoders (like the Soundtraxx
Tsunami in this example) do not support V-start, V-mid and V-max. So, if you are trying to
use the simplified method of speed matching locos, these decoders won't support it. Well now
you have a way. Check the left-hand, right-hand and middle columns. Set the left-hand column
to V-start, the right-hand to V-max and then slide the middle slider up and down until you
get the V-mid that you want. Now all you have to do is write this speed table to the loco and
you've accomplished what you wanted to do, but the decoder manufacturer didn't provide
for.
Substitute for Quick Speed Matching
If you want to set up a loco for switching you can set a start speed that is the same for the first portion of the throttle revolution and lower the top speed for use in the yard as shown below:
Switcher Speed Curve
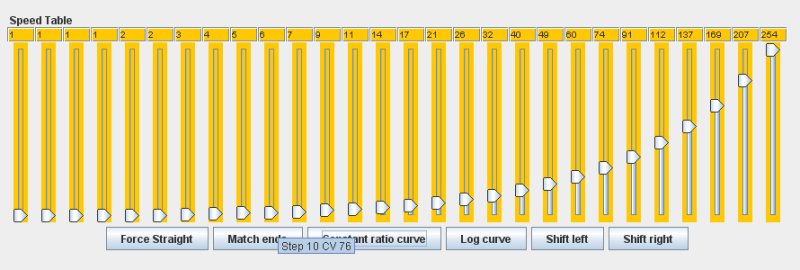
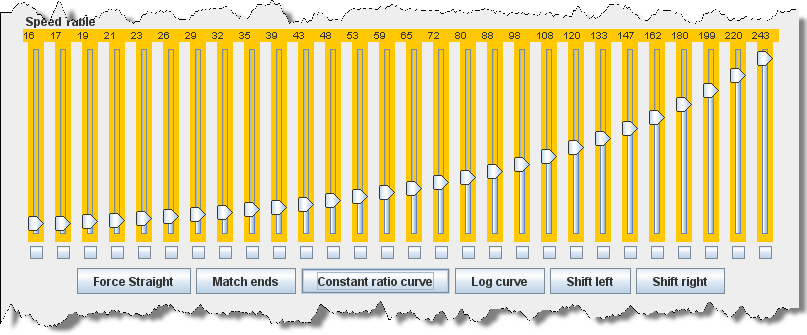
if you don't desire a strait-line response curve there are other options available. The Constant ratio curve gives you a response that increases slowly in the low end and rapidly at high throttle. This function will also draw the curve between preset end points.
Constant Ratio Curve
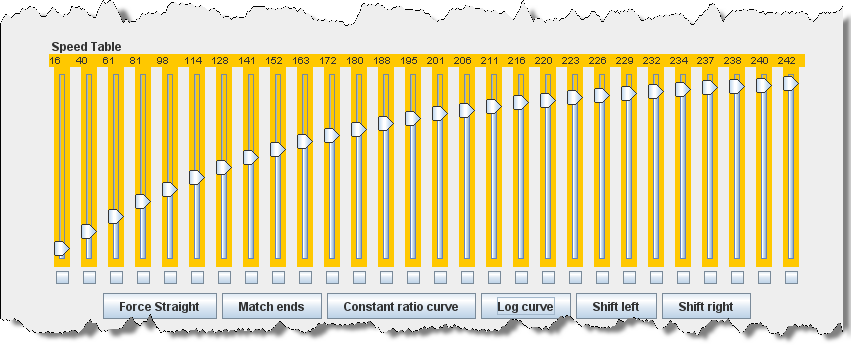
The Log curve reverses this response, giving you a logarithmic response curve with high acceleration at low speeds, but topping out quickly. It will also draw the curve between preset end points.
Logarithmic Speed Curve
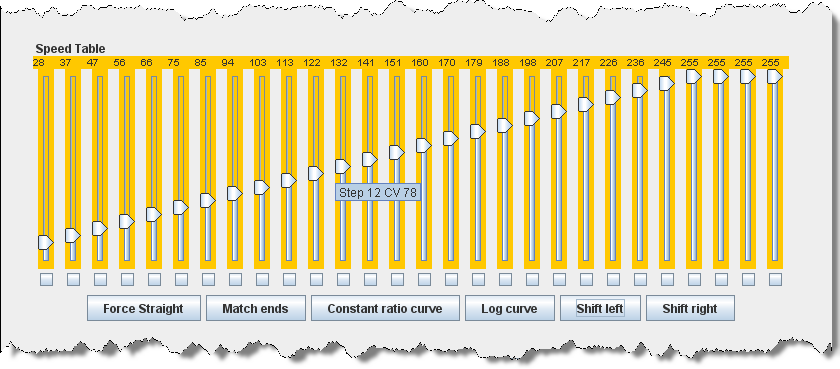
The moves the entire speed table to the left one space with each click on the button. The example below shows a linear 0-255 speed table that has been Shifted left three times.
Curve Shifted Left
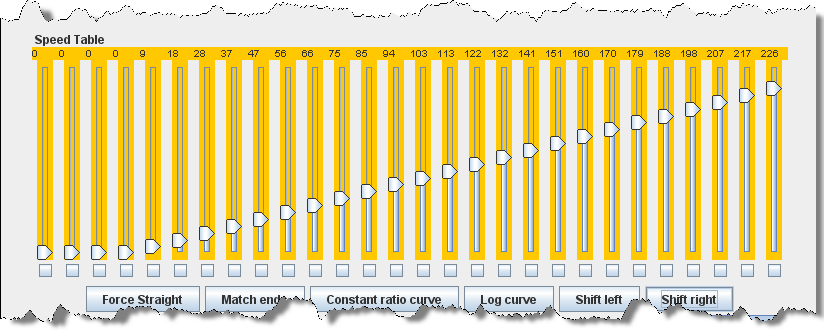
The move the entire speed table to the right one space with each click on the button. The example below shows a linear 0-255 speed table that has been Shifted right three times.
Curve Shifted Right
Of course, you can enter the numbers individually or move the sliders one at a time to create your own fully customized speed table. To aid you with setting the individual values, the slider value is shown at the top of each slider. Also, by hovering the mouse at a slider column the number of the CV being entered will be revealed.
One very important thing to remember: No matter how pretty your speed table looks, it has absolutely no effect on the locomotive unless you write it to the decoder!
And this point is especially pertinent with the QSI and Soundtraxx Tsunami decoders, because they have a separate drop down box like the QSI box below. They require that you select the user defined speed table entry in this box or your table will not be written to the decoder. Interestingly, Tsunami puts the selection at the bottom of the list making it very easy to miss.
